Prof Helen Margetts
Professor of Society and the Internet at the University of Oxford, where she was also Director of the Oxford Internet Institute from 2011 to 2018. She is Programme Director for Public Policy at The Alan Turing Institute for Data Science and Artificial Intelligence.
Email: helen.margetts@oii.ox.ac.uk

Dr Bertram Vidgen
Researcher at the Alan Turing Institute, Associate researcher at the University of Oxford and Visiting Fellow at the Open University
Email: bvidgen@turing.ac.uk
Twitter: @bertievidgen

Dr Scott A. Hale
Senior Research Fellow University of Oxford and Director of Research Meedan.
Email: scott.hale@oii.ox.ac.uk
Twitter: @computermacgyve
Section 1: Truth, Lies and Civic Culture
- Delusions of democracy
- What’s the election communication system like now?
- Sorry, not sorry: hubris, hate and the politics of shame
- The “coarsening” of campaigns
- GE2019 was not a Brexit election: trust and credibility, anti-politics and populism
- The online public shaming of political candidates in the 2019 general election
- Strategic lying: the new game in town
- Fact-checkers’ attempts to check rhetorical slogans and misinformation
- The election where British fourth estate journalism moved closer to extinction
- Rethinking impartiality in an age of political disinformation
- Fake news, emotions, and social media
- Unleashing optimism in an age of anxiety
- The rules of the campaign found wanting
The 2019 election may be remembered as much for the historic Conservative victory and the collapse of the Labour party as for being the “nasty election”. Here we offer an assessment of that epithet, including a rapid analysis of how candidates were targeted by toxic content on Twitter in the final week of the campaign.
Rising levels of hate and aggression have been observed in politics for several years, particularly since the 2016 referendum. They risk creating a toxic atmosphere, silencing dissenting voices and marginalising whole communities. Women MPs in particular have cited astonishing levels of misogynistic hate and rape or death threats,
These issues bedevilled both main parties from the start of the campaign, when Heidi Allen stood down citing “nastiness and intimidation“. Accusations of prejudice and harassment were levelled at the parties and candidates themselves. The UK’s Chief Rabbi denounced Labour over anti-Semitism and one Labour MP claimed that Corbyn’s “inaction on anti-Semitism had turned it into the ‘nasty party’”. The Conservatives received accusations of Islamophobia from their own politicians, such as Baroness Warsi, and made constant references to Boris Johnson’s racist and Islamophobic use of language. Conservative, Scottish Labour and Lib Dem candidates were investigated or expelled for anti-semitism, while the Brexit party expelled activists for “hideous” racist abuse. As anti-racist organization Hope Not Hate claimed in the aftermath, “Among marginalized communities, there is a real angst and fear….It was a really ugly campaign.”
Here we investigate the last week of the campaign, a period often associated with greater vitriol as parties make their final pitch, by examining tweets sent to candidates. Our dataset comprises 5.1 million tweets, analysed using Perspective, a tool to identify ‘toxic’ comments developed by Google Jigsaw. 103,837 (2%) tweets were identified as toxic, which were sent to 939 of the 2,620 candidates. The remaining 1,681 did not receive any toxic tweets.
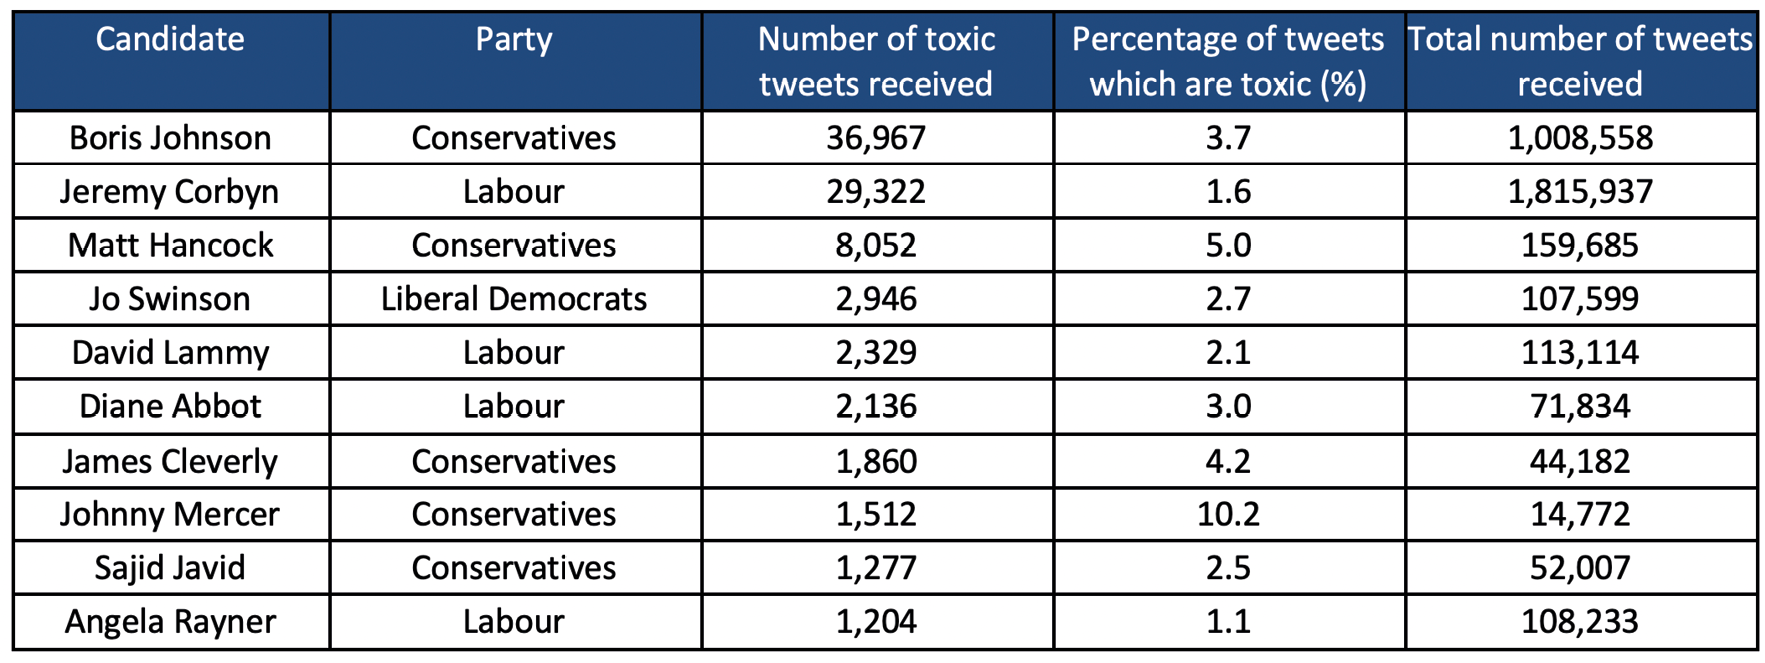
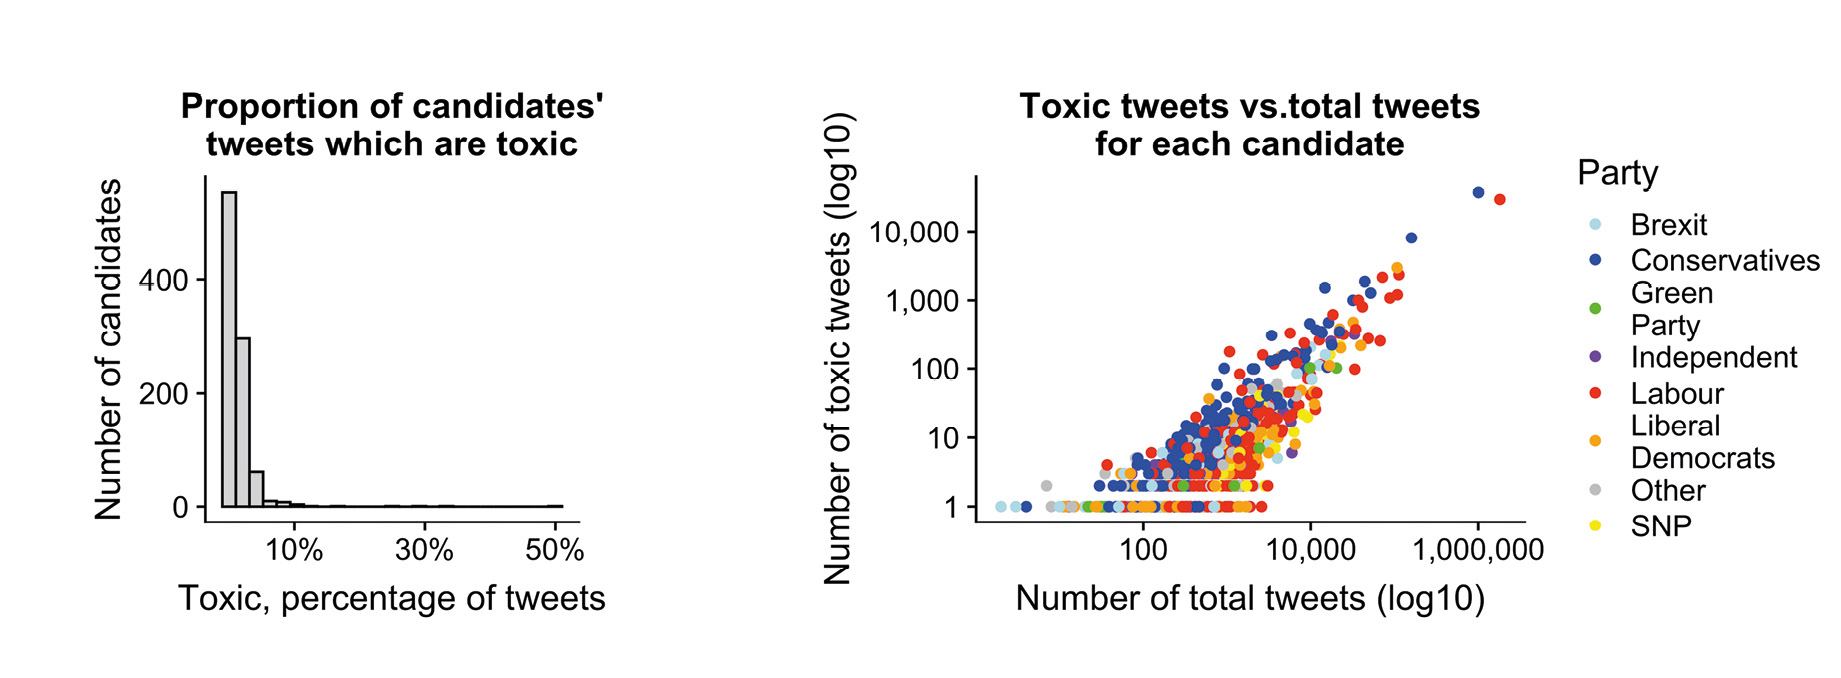
We see a high variation in the levels of toxicity received by candidates, even amongst the top ten most targeted (Table 1). Conservatives and Labour party leaders received the greatest number of toxic tweets, Johnson received most, 36,967, one-third of the total. Nearly 4% of his tweets were toxic, compared with 1.6% of Corbyn’s. The distribution of the percentage of toxic tweets across all candidates exhibits even larger variations. Figure 1(a) shows a fat-tailed distribution (typical of internet-based phenomena) with a small number of candidates receiving high proportions, for the majority less than 2% of tweets were toxic.
Party affiliation captures some key differences in the level of toxicity, as shown in Figure 1(b). Conservative candidates received a larger proportion of toxic tweets (3.5%), compared with 1.5% for Labour. This finding is robust whether party leaders are included or not. There is a strong positive relationship between the total number of tweets that candidates received and the number of toxic tweets, holding across all parties. However, this relationship is sublinear: the more tweets that candidates received, the smaller the proportion that were toxic, with notable exceptions (e.g. Boris Johnson and Johnny Mercer), the result of which makes it difficult to generalize about candidates’ experiences.
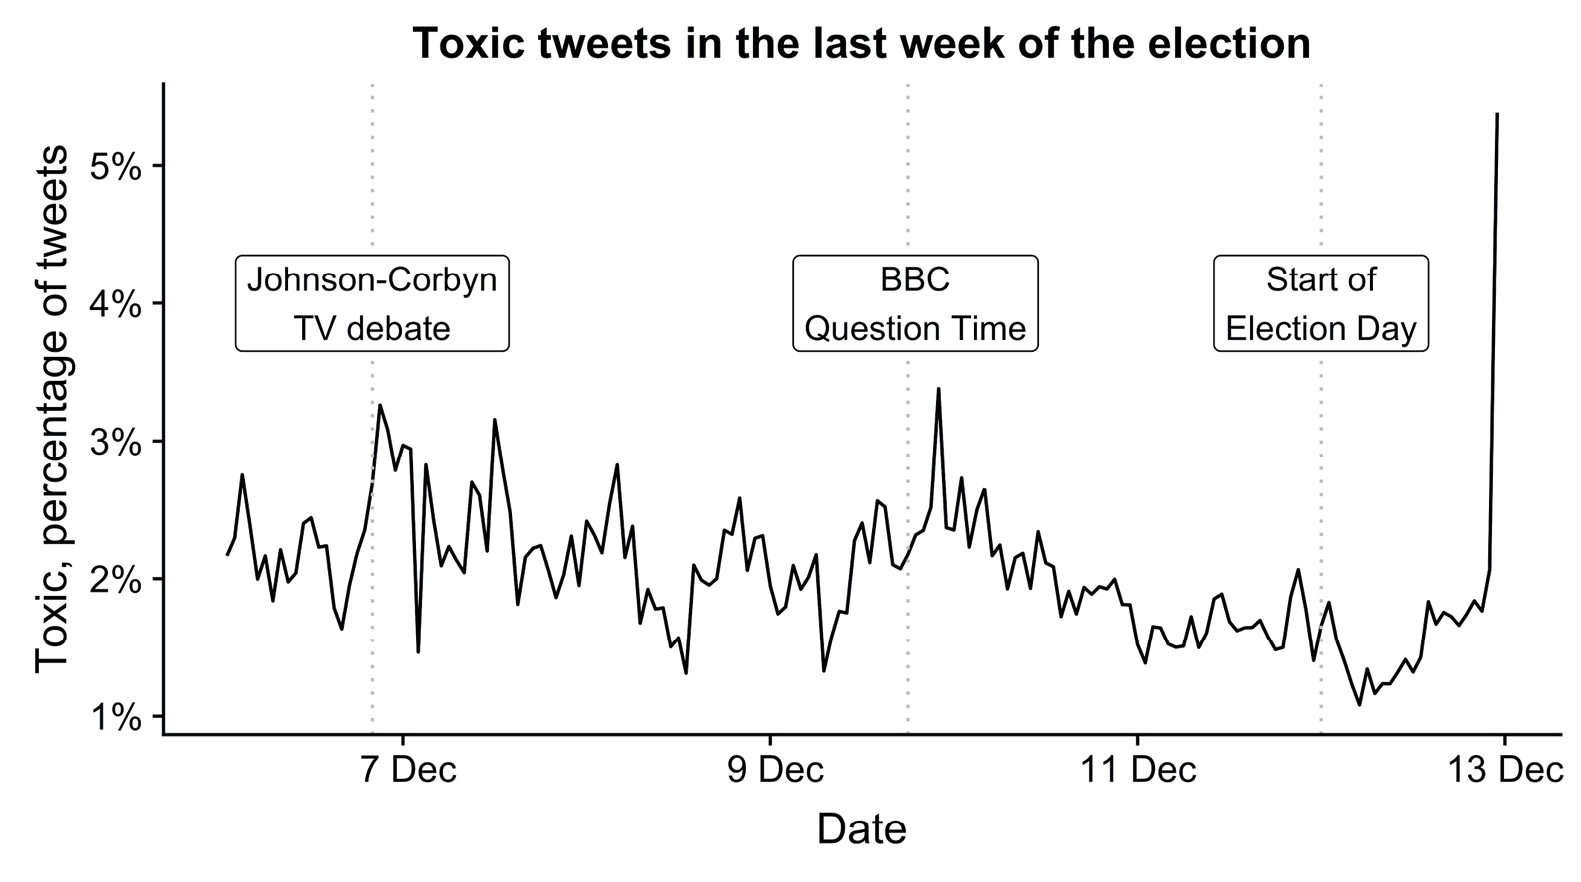
Finally, the volume and proportion of toxic tweets which were sent varied hugely over time across the last week. For volume, there were three clear spikes related to key campaign events: the Johnson-Corbyn BBC debate (6th Dec), Question Time (9th) and election day (12th). However, accounting for the total number of tweets sent to candidates each hour, only the day of the election is still a large spike (Figure 2), when toxicity levels were highest. For some candidates the overwhelming majority of abuse they received was on election day; Diane Abbott, for example, attracted media attention for wearing two left shoes when going to vote, accounting for 63% of the toxic tweets she received.
In a time when so much of politics is organised, mobilized and discussed online, hate speech and interpersonal aggression on social media pose huge problems which need to be effectively countered. If not, we risk discouraging whole generations of young women, or people from religious or racial minorities, from political participation. As our recent Turing policy briefing shows, collating the necessary evidence to assess the prevalence and impact of online abuse is difficult, but essential. Here we have provided initial insight into how candidates received online abuse in the last throes of the election campaign. This will be explored in future work as part of our ongoing efforts to better detect, understand and counter online hate. To this end, we are creating a real-time ‘Online Hate Monitor’ for online abuse, including hate directed against elected politicians, which will be publicly available for all to use.