Dr Matthew Wall
Associate Professor in Politics at Swansea University. His research focuses on the intersection of electoral politics and digital technologies. The work presented here stems from an Arts and Humanities Research Council funded project (AH/L010011/1) on using gambling odds to analyse election campaigns.
Email: m.t.wall@swansea.ac.uk
Twitter handle: @wallmt

Jack Tudor
PhD student in the Department of Political and Cultural Studies at Swansea University.
Email: j.tudor.653998@swansea.ac.uk
Twitter: @jack_tudor
Section 2: Voters, Polls and Results
- Boris’s missing women
- Unprecedented interest or more of the same? Turnout in the 2019 election
- Cartographic perspectives of 2019 General Election
- Tactical voting advice sites
- Another election, another disappointment: Young people vote left and are left behind at GE2019
- Divided we fall: was Nigel Farage the kingmaker of the Johnson victory?
The election result came as a surprise to many people. Boris Johnson himself was reported to have been stunned by the scale of his majority as revealed by the 10pm exit poll, while John McDonnell acknowledged that the same poll had come as a shock to him. The starkness of that 10 o’clock prediction of 368 seats for the Conservatives against a mere 191 for the Labour Party also caught the breath of members of the public, with The Telegraph posting a video capturing the “audible gasps” of onlookers in front on the big screen outside of BBC headquarters in London.
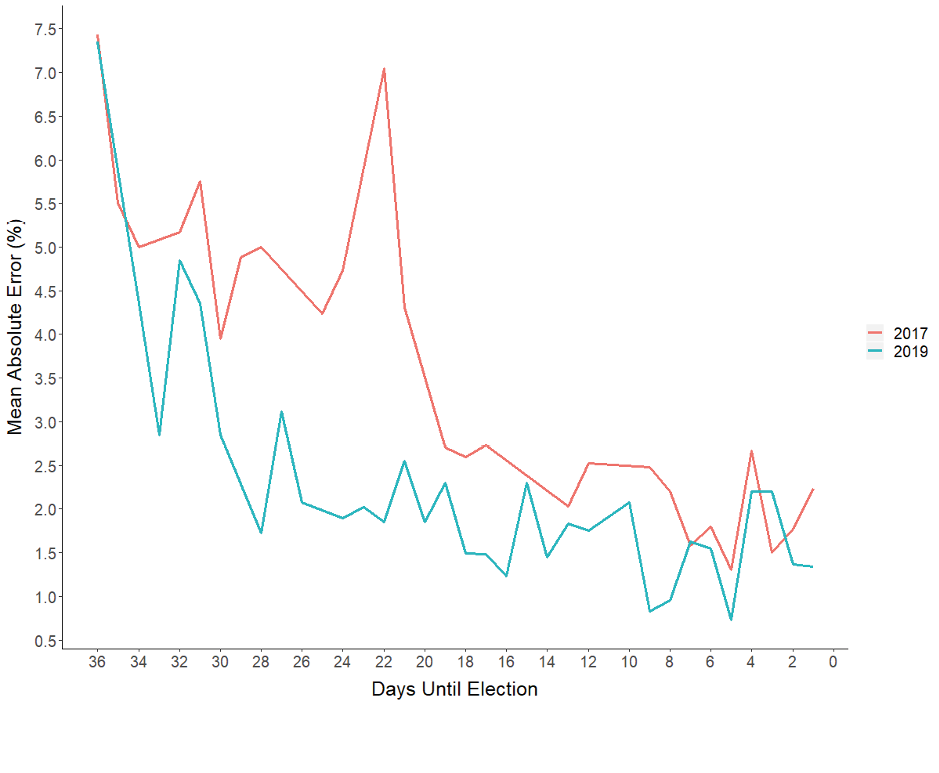
This leaves us to ponder whether the election was well-predicted. Let’s begin by taking a closer look at the polls. We collected a total of 70 poll-based vote projections, capturing what we believe to be all published, national-level polls reported during the campaign period. In order to evaluate these figures, we use a metric called Mean Absolute Error (MAE), which captures the extent to which polling figures deviated from the eventual result in terms of party vote shares.
Overall, 2019’s polls produced an average MAE of 2.2%, representing a marked improvement on the equivalent 3.2% figure from 2017. Furthermore, the polls became noticeably more accurate as the election approached, in line with conventional theory. If we look at the 20 polls released in the final week of the campaign, the average MAE lowers to just 1.4%.
One of the most notable polling trends, discussed in detail by Fisher and Snow, was “the extent to which polls differ primarily between pollsters, with relatively little change over time for each pollster”. This runs contrary to previous UK elections where a phenomenon known as ‘herding’ saw pollsters reluctant to publish individual findings that deviated from aggregate patterns. In the final analysis, we can therefore see a significant divergence in accuracy from one polling company to another – with, for example, BMG more than twice as inaccurate (with an average MAE of 3%) as the top-performing major company: Ipsos MORI (with an average MAE of 1.4%).
The strong performance of the pollsters provided a solid foundation for forecasters seeking to predict party seat shares. Because of the capricious nature of the UK’s electoral system, predicting seat distributions is not a straightforward enterprise. One common approach is to map between-party vote swings implied by a poll onto the previous constituency-level voting patterns (using the simplifying assumption that swing will be uniform across all seats). From this process, our 70 polls produced an average seat forecast of 350 for the Conservatives. The substantive political conclusion of a Conservative majority was replicated across 66 (or 94.3%) or our 70 polls. Applying the same procedure for 2017’s polls, only 18.6% had suggested a hung parliament.
This type of prediction was widely replicated across alternative methods – for instance Fisher, Kenny and Shorrocks noted that a combination of betting market forecasts and votes-to-seats models ranged between predictions of 343 to 351 seats for the Conservative Party. YouGov’s multilevel regression and post-stratification (MRP) model, which had been lauded for being ahead of the curve in predicting a hung parliament in 2017, forecast a slightly tighter outcome in its final iteration – landing on a Conservative seat prediction of 339. The most misleading major seat forecast came from members of the Political Studies Association, whose average prediction of 324 Conservative seats was well under most other forecasts and would have represented a radically different political outcome than the eventual result.
As such, a substantial Conservative majority was a broadly well-predicted result. The polls were largely accurate (albeit with considerable deviation across polling companies) and an array of methods which set out to forecast seat shares also performed well, even if the eventual figure of 365 for the Conservative Party was slightly higher than most predictions.
So, how do we explain the paradox of an expected surprise? To do so, we must consider the ‘narrative’ element of how polls and forecasts are reported. Recent election shocks in the UK have led to greater caution in trumpeting results among experts, while a narrative of a close and/or tightening election in fact suited both main parties – with the Conservatives guarding against complacency and Labour seeking to maintain hope. Posts on social media showing large numbers of young people lined up at polling stations on election day fed into this pre-baked narrative. In the end, however, this was an election result that was in line with the reasonable expectations of those who followed the polls.