
Prof Ron Johnston
Professor of Electoral and Social Geography at the University of Bristol.
Email: r.johnston@bristol.ac.uk
Twitter: @ProfRJohnston

Prof Charles Pattie
Professor of Geography at the University of Sheffield.
Email: c.pattie@sheffield.ac.uk

Section 2: Voters, Polls and Results
- Boris’s missing women
- An expected surprise? An evaluation of polls and seat forecasts during the campaign
- Cartographic perspectives of 2019 General Election
- Tactical voting advice sites
- Another election, another disappointment: Young people vote left and are left behind at GE2019
- Divided we fall: was Nigel Farage the kingmaker of the Johnson victory?
When Britain’s first winter election since February 1974 (and its first December election since 1923) was called for 12 December 2019, there was some speculation that turnout would fall substantially. Would voters, already tired out by three general elections and one referendum in the space of four years, be willing to go to the polls on a cold, dark winter’s day – potentially in bad weather – in the run-up to Christmas?
On polling day itself, however, early reports seemed to belie those gloomy predictions. From quite early in the morning, stories began to circulate about unprecedented voter interest and of long queues forming outside polling stations. In some areas, pictures shared online showed these queues snaking round the block. Was the UK emerging out of a twenty-year period of relatively low electoral turnouts and heading back to participation rates more typical of the years from 1945 to 1997? And, if this was happening, what might it mean for the election result?
In the event, however, expectations for either much lower or much higher than expected turnout proved misplaced. Far from heading sharply upwards, turnout, at 67.3%, was actually lower than in 2017 (when it reached 68.7%, the highest level recorded since 1997, though still well below the post-war average). This put an end to a 4-election run of (slowly) rising participation from the post-war low point of the 2001 election. The long queues may have been more a result of the number of polling stations, and of votes’ desire to vote in daylight rather than in the dark and cold of a mid-winter night, than of any new-found engagement with politics.
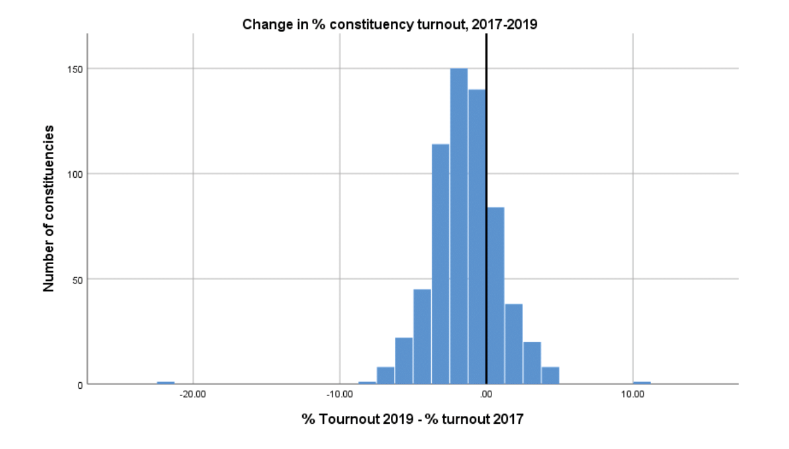
At the constituency level, too, the 2019 turnout story was a case of same old same old! Turnout in Britain varied from a low of 49.3% in Kington up Hull East to a high of 80.3% in East Dunbartonshire (the closely-fought seat defended by Liberal Democrat leader Jo Swinson, and lost to the SNP by only 149 votes). The overall range in turnout was very similar to that seen two years previously (when it ranged from 53% in Glasgow North East to 79% in Twickenham). And few constituencies saw major change in turnout between 2017 and 2019, as illustrated in this histogram of the percentage point increase or decrease in turnout between 2017 and 2019. The thick vertical line shows where the two turnouts were identical. To the left of that line are constituencies where turnout fell, and to the right are seats where it rose: the height of the bars shows the number of constituencies at each step along the way. Turnout fell in most constituencies (there is more of the graph to the left of the ‘zero change’ line than to the right), but in most cases the change was modest – only a few percentage points either way. There are two dramatic outliers – but they are quickly explained. On the far left of the graph, with a decline in turnout of 21.1 percentage points, is Chorley, the constituency represented by Lindsay Hoyle, the newly elected Speaker of the Commons. To the right is Buckingham, where turnout jumped by 10 percentage points, and where the outgoing MP was John Bercow, the previous Speaker. As the Speaker’s constituency is, by tradition, not contested by the major parties, these dramatic shifts are easily accounted for – by the absence of most parties in Speaker Hoyle’s seat and the sudden increase in the number of candidates in the seat formerly held by Speaker Bercow. But those unusual cases aside, changes were modest.
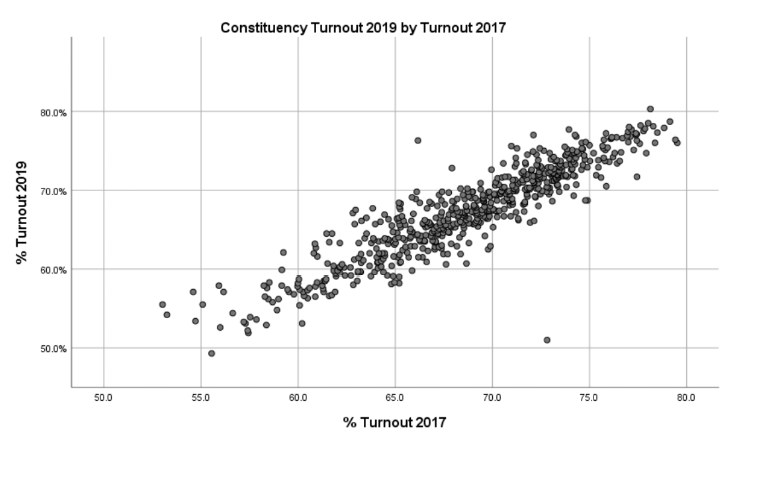
Not surprisingly, therefore, a very (very) strong predictor of the turnout rate in a seat in 2019 was the turnout there in 2017, as our second diagram illustrates. For those of a statistical turn of mind, the regression equation which describes the pattern in the diagram has an r2 of 0.83 (confirming that past turnout was a very major factor in understanding the rate in 2019), and the slope coefficient was 1.05 – in other words, the relative position of each constituency barely changed, and the slight drop in turnout was pretty similar across the two elections almost everywhere.
Expectations of either a particularly low turnout election or of a high-intensity, highly engaged contest were both confounded, therefore. Britain’s voters turned out in much the same proportions in 2019 as in most recent elections – and turnout remains below the levels routinely seen before 2001. Whatever the other dramas produced by the 2019 campaign, aggregate turnout was not one of them.