Dr Richard Fletcher
Research Fellow at the Reuters Institute for the Study of Journalism, University of Oxford. He is lead researcher and co-author of the Reuters Institute Digital News Report.
Email: richard.fletcher@politics.ox.ac.uk
Section 5: The Digital Campaign
- Corbyn, Labour, digital media, and the 2017 UK election
- Was it ‘AI wot won it’? Hyper-targeting and profiling emotions online
- Sharing is caring: Labour supporters use of social media #GE2017
- Like me, share me: the people’s social media campaign
- The alternate and influential world of the political parties’ Facebook feeds
- Social media and the Corbyn breakthrough
- The UK digisphere and the 2017 election
- From voices to votes: how young people used social media to influence the General Election
- All LOLs and trolls
Conventional wisdom has it that election campaigns make little difference to the overall election result. However, this doesn’t appear to be true of 2017, as Labour – who had been slowly losing ground to the Conservatives in polling conducted before the election was called – reduced a gap of 24 percentage points (by some estimates) to less than 3 points in the final result.
Much of the analysis of the 2017 election will therefore be focussed on the campaigns. Many believe that the Conservatives ran a flawed campaign, and this is undoubtedly part of the story. Labour both appealed to and targeted younger voters, and because social media is an important source of information for younger people, it was a key part of their strategy. Before polling day had arrived, a report by the Oxford Internet Institute revealed that Labour dominated the election conversation on Twitter, lending support to a view among digital strategists that Labour had indeed won the ‘social media election’ (if not, as it turned out, the actual election).
Online video has been singled out as a specific area in which Labour outperformed the other parties. I’ve used CrowdTangle – a tool that monitors the output of social media accounts – to see whether this view is supported by the data. I’ve used it to compare the output of the official Facebook accounts of 6 parties (Conservatives, Labour, Liberal Democrats, UKIP, SNP, and the Greens) during the 2015 and 2017 general election periods, looking in particular at the volume of video posts. I’ve focussed on Facebook, as it is by far the most widely-used social network in the United Kingdom (63% of the online population use Facebook each week, and 80% of 18-24s), and because there is a lack of studies based on Facebook data.
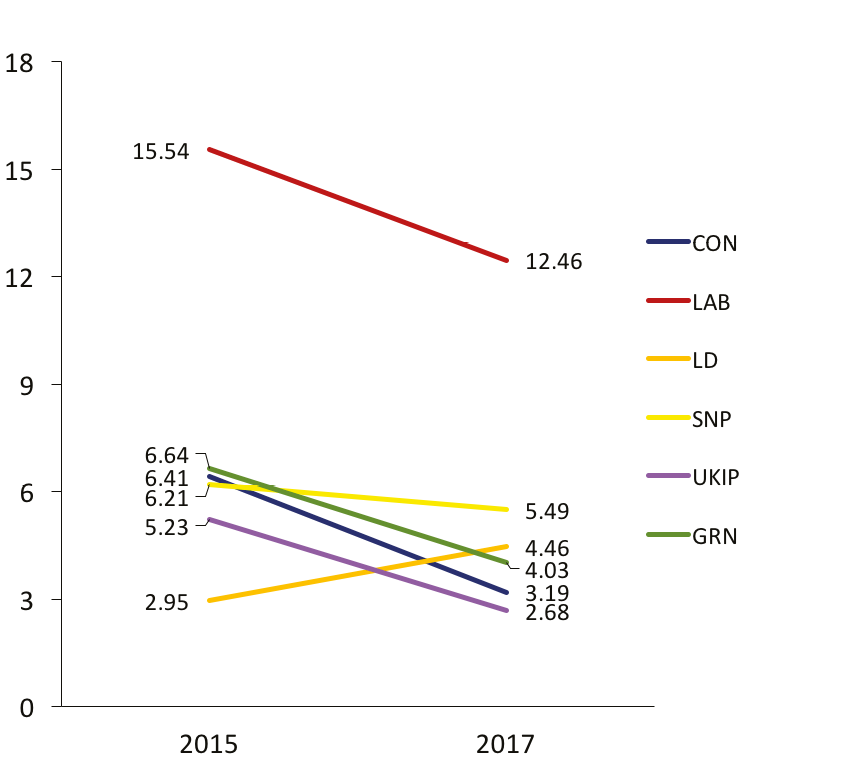
To start, I compared the number of posts made by each official party account in 2015 and 2017. Somewhat surprisingly, the average number of posts per day from all parties except the Liberal Democrats was slightly lower in 2017 than in 2015 (I use average number of posts per day rather than the raw figure because the 2015 election period was slightly longer than in 2017). But during both elections, Labour posted over twice as many times to Facebook as any of the other parties, posting an average of 12 times per day in 2017, compared to 3 to 5 times per day for the rest (see Figure 1).
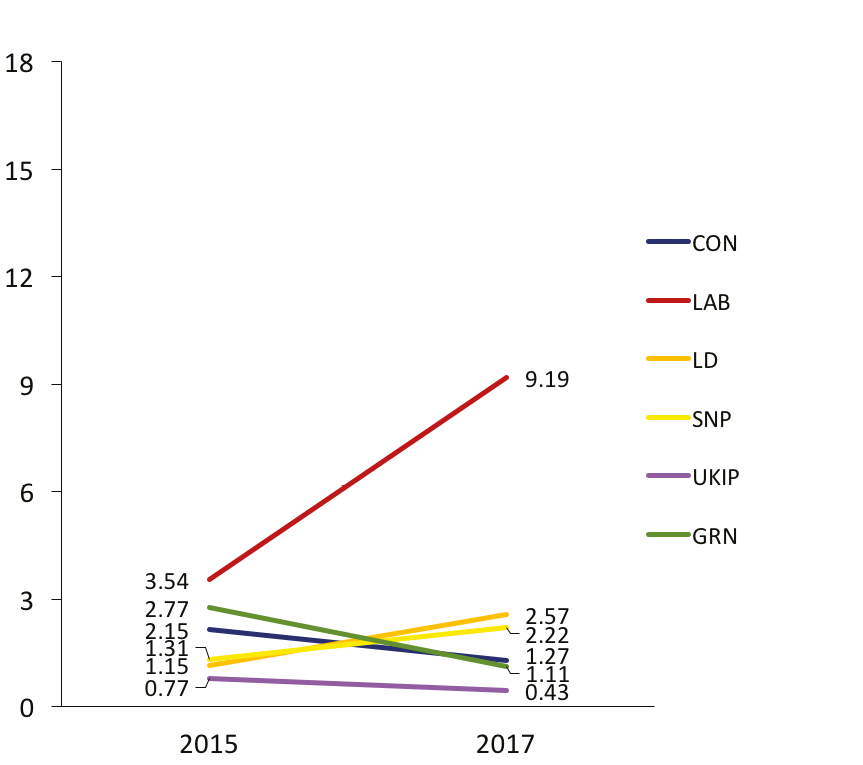
So, what did Labour do differently in 2017? One answer is that they posted more video. The Liberal Democrats and the SNP both posted slightly more videos per day in 2017. The Conservatives, UKIP and the Greens posted fewer. But Labour, who already made more use of video in 2015 than any of the other parties, nearly trebled their number of video posts, from just over 3 per day in 2015 to over 9 per day in 2017. This means that around three-quarters of all posts from the official Labour account included a video of some kind (see Figure 2).
This matters, because for all parties in 2017 videos were more likely to produce an interaction (defined as a like/dislike, a share, or a comment) than any other type of post (such as an image, a link, or a status update). This is likely to be linked, in part, to Facebook’s earlier decision to prioritise video content in people’s news feeds. Labour were therefore particularly successful at generating interactions during the election period, producing around 2.5 million in total, compared to 1 million for the Conservatives, and no more than 400 thousand for any of the other parties. This is partly because they posted more often. But importantly, around 90% of all of Labour’s likes, shares, and comments came from video posts. This figure is much higher than the equivalent figure for the Liberal Democrats (around 70%), the Conservatives, the SNP, and the Greens (between around 50% and 55%) and UKIP (around 33%).
Of course, the content of these videos is important, and more in-depth analysis will help build a richer understanding. Nonetheless, this data suggests that during the 2017 campaign Labour were indeed able to attract the attention of social media users through the use of engaging video content, which may have ultimately had some bearing on the eventual result.