Prof Christopher Carman
Stevenson Professor of Citizenship at the University of Glasgow. He has been one of the lead researchers on the Scottish Election Study since 2011 and has written several books and articles on Scottish voting, public opinion and elections. His most recent research examines preferences for compromise in politics.

Prof Ailsa Henderson
Ailsa Henderson is Professor of Political Science at the University of Edinburgh and Principal Investigator for the Scottish Election Study 2026-2031.

Scottish Election 2026
Section 3: Voters, polls and the electoral system
- Elections and voting as rituals: Comparing Scotland with Australia (Prof Ariadne Vromen)
- The electoral system: The most disproportional result yet (Prof Sir John Curtice)
- The system is working (as intended): What Scottish voters actually wanted on 7 May 2026 (Prof Christopher Carman, Prof Ailsa Henderson)
- The Meh election? Campaign dynamics in the 2026 Scottish Parliament election (Prof Christopher Carman, Prof Robert Johns)
- MRPs: a false dawn (Dr Eoghan Kelly)
- Changing electoral battlegrounds: The rise and fall of extreme two-party contests (Prof Ailsa Henderson)
- Distinctively left-wing? Comparing young Scottish people to the rest of the UK and older Scots (Dr Joe Greenwood-Hau)
- Scotland: A country of aging disruptors? (Dr Jan Eichhorn)
- Shifting tides: Gender, independence and constitutional politics in the 2026 Scottish election (Dr Emilia Belknap)
- Why did Reform make a breakthrough? Evidence from the Scottish Election Study (Dr Fraser McMillan)
- Mapping Reform UK’s vote in the 2026 Scottish Parliament election (Dr Davide Vampa)
- The SNP: hegemony in a time of crisis? (Dr Sebastian Dellepiane-Avellaneda, Prof Anthony McGann)
If you followed coverage of the 2026 Scottish Parliament election, you could be forgiven for thinking only one question mattered: would the SNP clear 65 seats and win a majority? From February’s first MRP poll to election night, Scottish and UK media framed the campaign around John Swinney’s chances of an outright win. Drawing on the Scottish Election Study 2026 pre-election wave — which surveyed roughly 4,000 Scots during the formal campaign period — we argue that this framing misrepresented what Scottish voters wanted and inflated their expectations beyond what the electoral system was designed to produce.
The Additional Member System (AMS) was chosen for Holyrood deliberately. Devolution’s architects wanted a more consensus-based politics than Westminster’s first-past-the-post, where in 2024 Labour took 63% of the seats with 34% of the vote. AMS does not block majorities; it limits the artificial boost first-past-the-post confers. The SNP’s 2011 majority was widely treated as a statistical anomaly — yet it seems to have permanently recalibrated media expectations. Every Holyrood contest since has been narrated through whether one party can repeat what the system was designed to discourage.
Six MRP polls were published between February and the eve of the election. Across mainstream Scottish and UK outlets, the dominant headline frame was binary: would the SNP win a majority or fall short? The pro-independence majority — SNP plus Greens above 65 seats — appeared in some YouGov write-ups and in The National, but as a secondary thread. Substantive discussion of AMS itself was almost entirely absent, aside from posts by the Electoral Reform Society and Ballot Box Scotland.
And John Swinney actively cultivated this frame. With support for independence running ahead of support for the SNP, a majority-or-nothing pitch was a rational way of converting a broader constitutional coalition into single-party votes. Swinney set the bar; the media reported whether he cleared it.
What voters actually wanted
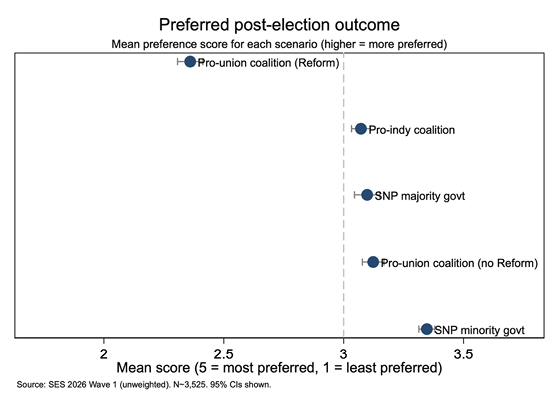
We asked respondents to rank five possible post-election outcomes (1= least preferred; 5 = most preferred). The most striking finding: SNP minority government was the most preferred overall (mean rank 3.35), ahead of a pro-union coalition without Reform (3.12), an SNP majority (3.10) and a pro-independence coalition (3.07). A pro-union coalition including Reform was clearly least preferred (2.36).
At the individual level the picture is stark: 56.8% of respondents preferred SNP minority over SNP majority when directly compared, and a quarter ranked an SNP majority as their least preferred outcome.
Party identification dominates the rankings, as expected: SNP identifiers strongly prefer a majority; Conservative and Reform identifiers strongly oppose one. Yet around one in ten SNP identifiers rank minority above majority. Voters also treated “SNP majority” and “pro-independence coalition” as meaningfully different outcomes: constitutional preference and single-party majoritarianism are not the same thing.
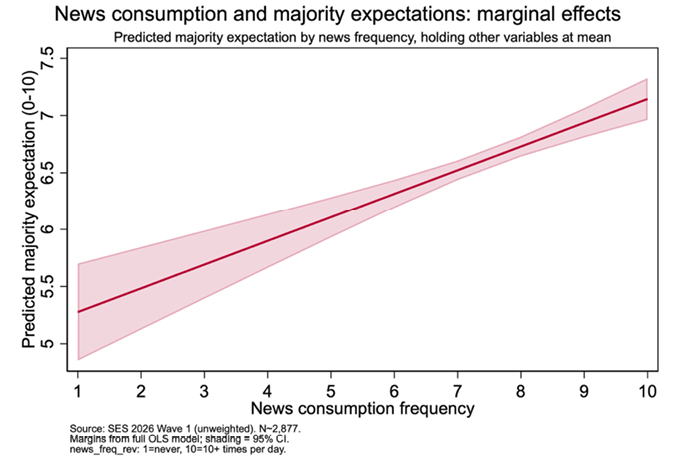
Voters’ expectations told a different story from their preferences. Asked how likely an SNP or pro-independence majority was on a 0–10 scale, the mean response was 6.53 (median 7), with more than half placing it in “fairly likely” territory on the eve of an election the polls were describing as too close to call. Voters were expecting something they did not particularly want.
Modelling voter preferences and voter expectations side by side clarifies why. Party identification and constitutional identity (supporting Scottish Independence or not) dominate both. Voters’ news-consumption frequency and using social media for news both independently predict higher majority expectations (controlling for party identity, constitutional identity, and ideology), but neither has any significant independent effect on majority preferences.
Heavier media consumers, in other words, did not want a majority any more than lighter ones; they simply expected one more strongly. The majority frame did not change what voters wanted — political preferences do that — but it calibrated what they thought would happen.
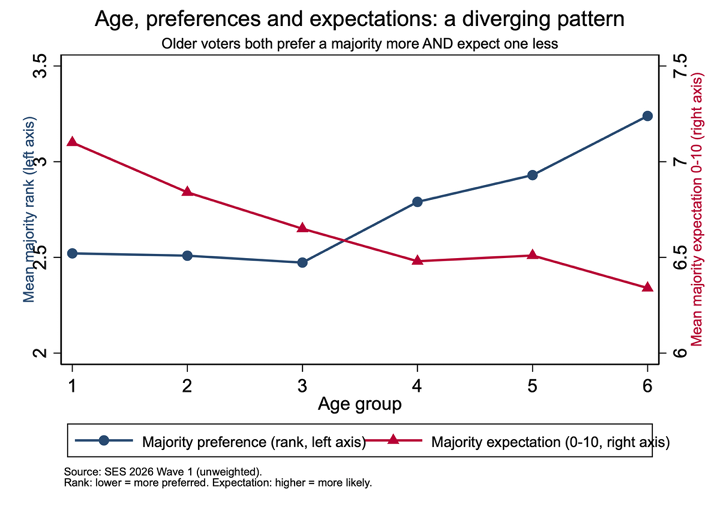
The clearest demographic finding concerns age, and it survives controls for party, identity, ideology, education, gender and media consumption. Younger voters are more comfortable with non-majority outcomes: 16–24s give an SNP majority a mean rank of 2.52 and 35–44s 2.47, compared with 2.93 for 55–64s and 3.24 for those aged 65 and over. The gradient is smooth and monotone.
There is an intriguing crossover: younger voters prefer majority government less yet expect it more. The 16–24s have the highest mean expectation (7.10) but among the lowest preference. One reading is that cohorts who have lived their politically aware lives entirely under devolution have more accurate intuitions about what AMS produces, while still being exposed to coverage that inflated everyone’s expectations.
The minority government outcome on the 7th of May is the result of a system working as designed. The SES data show voters did not, in aggregate, prefer a single-party majority; indeed, many actively preferred a minority. Where the media coverage left a mark was on expectations. Any post-election sense of disappointment will not come from AMS producing the “wrong” result, but from coverage that spent months telling voters they should assess the outcome based on something the system was designed to avoid.