Prof Christopher Carman
Stevenson Professor of Citizenship at the University of Glasgow. He has been one of the lead researchers on the Scottish Election Study since 2011 and has written several books and articles on Scottish voting, public opinion and elections. His most recent research examines preferences for compromise in politics.

Prof Robert Johns
Professor of Politics at the University of Southampton. He has been one of the lead researchers on the Scottish Election Study ever since 2007 and has written several books on Scottish voting and on the SNP in particular.

Scottish Election 2026
Section 3: Voters, polls and the electoral system
- Elections and voting as rituals: Comparing Scotland with Australia (Prof Ariadne Vromen)
- The electoral system: The most disproportional result yet (Prof Sir John Curtice)
- The system is working (as intended): What Scottish voters actually wanted on 7 May 2026 (Prof Christopher Carman, Prof Ailsa Henderson)
- The Meh election? Campaign dynamics in the 2026 Scottish Parliament election (Prof Christopher Carman, Prof Robert Johns)
- MRPs: a false dawn (Dr Eoghan Kelly)
- Changing electoral battlegrounds: The rise and fall of extreme two-party contests (Prof Ailsa Henderson)
- Distinctively left-wing? Comparing young Scottish people to the rest of the UK and older Scots (Dr Joe Greenwood-Hau)
- Scotland: A country of aging disruptors? (Dr Jan Eichhorn)
- Shifting tides: Gender, independence and constitutional politics in the 2026 Scottish election (Dr Emilia Belknap)
- Why did Reform make a breakthrough? Evidence from the Scottish Election Study (Dr Fraser McMillan)
- Mapping Reform UK’s vote in the 2026 Scottish Parliament election (Dr Davide Vampa)
- The SNP: hegemony in a time of crisis? (Dr Sebastian Dellepiane-Avellaneda, Prof Anthony McGann)
Whilst the 2026 Scottish Parliament election produced a colourful, rainbow parliament, it came out of what was largely characterised as a rather bland campaign. Commentators struggled to find a memorable moment, and many concluded the campaign had failed to ignite the public imagination. Perhaps this reflected existing public apathy; perhaps it also encouraged it. In the event, turnout at 53% was back down to the levels seen in Holyrood elections before the independence referendum energised Scottish politics.
Was 2026 really the “Meh Election”? Or did it move voters? The pre-election wave of the Scottish Election Study (SES), which interviewed 4,066 Scottish voters across the 27 days before polling day, allows us to ask. Tracking engagement, evaluations, trust, efficacy and vote intention week by week, the short answer is: not very much. However, what did happen was probably enough to matter at the margins.
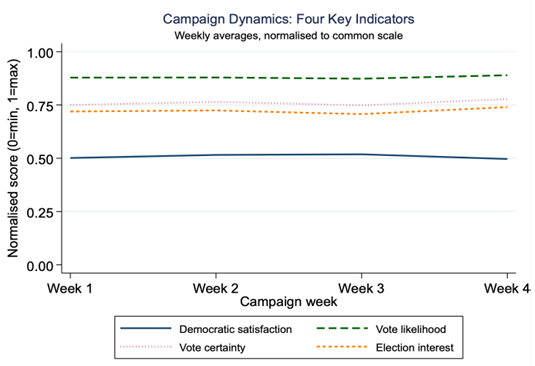
The four headline measures of campaign engagement – satisfaction with how democracy is working in Scotland, likelihood to turn out, certainty of vote choice, and election interest – barely moved across the four weeks. Standard tests of week-to-week differences are comfortably non-significant, with the partial exception of interest, and trend models confirm the picture. Figure 1 shows the central finding: four near-horizontal lines across four near-identical weeks.
Trust in Holyrood (mean 4.46 on a 0–10 scale) and in Westminster (3.06) was stable across the four weeks, as was the longstanding Holyrood-minus-Westminster gap of about 1.4 points. Government performance evaluations and political efficacy were similarly flat across all subgroups.
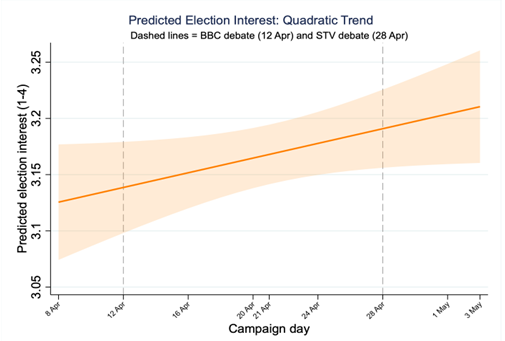
Vote intention was almost as settled: around 83% of respondents gave a stated answer on either ballot in both Weeks 1 and 4, though “Don’t know” responses fell steadily by about 0.2 percentage points per day, evidence that voters were at least finding enough in the campaign to help make up their minds. Figure 2 picks out the only indicator with a hint of upward drift: predicted election interest, already quite high, edges from around 3.13 on 8th April to 3.21 by 3rd of May. If one squints at Figure 2, the campaign did warm the electorate up a wee bit.
A small late shift in the parties’ fortunes
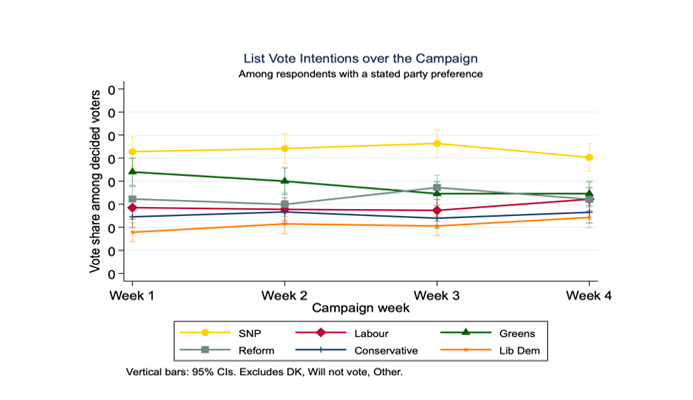
The one place where genuine campaign movement is detectable is on vote intention, particularly on the regional list (Figure 3). The SNP held a clear lead throughout, but its share dipped from 28.2% in Week 3 to 25.2% in the closing week. Labour sat around 14% for three weeks before rising to 16.1% in Week 4. The Liberal Democrats climbed steadily from 8.9% to 12.1% – the only party with a statistically significant improvement. The Greens slipped from 22.0% to 17.3% – nearly five points, and the only statistically significant decline.
Reform’s pattern is the most interesting. The party’s support spiked up towards 19% in Week 3 before returning to 16.1 in Week 4 – just where they started. The week-on-week swings are not statistically significant on their own, but the timing is suggestive: Reform’s late drop coincides with the STV debate, in which Malcolm Offord’s remarks about his houses, boats and cars were one of the closest things to a big “moment” in the campaign.
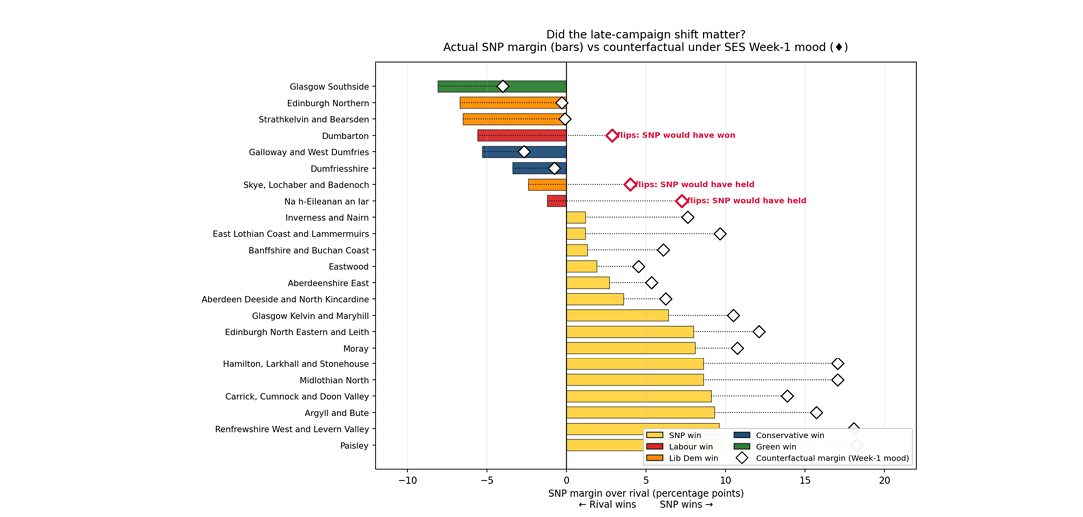
A small wobble in vote intention is one thing; whether it altered outcomes on the 7th of May is another. The SES Week-1 to Week-4 constituency-ballot swings were −4.1 points for the SNP, +4.4 for Labour, +2.3 for the Liberal Democrats, −1.5 for the Conservatives and +0.7 for Reform. Applied as a uniform national swing in reverse – asking the counterfactual of who would have been ahead had the Week-1 mood persisted to polling day – three of the SNP’s narrow defeats turn into narrow wins.
Figure 4 plots the SNP’s margin over its main rival in each of the closer races. In Na h-Eileanan an Iar, where Donald MacKinnon won for Labour by just 154 votes, the Week-1 counterfactual leaves the SNP seven points ahead. In Dumbarton, a comfortable Labour hold becomes a narrow SNP win; and Skye, Lochaber and Badenoch also goes to the SNP, in that case from the Liberal Democrats. The SNP would have taken 60 seats rather than 57, with Labour cut from three to one and the Liberal Democrats from seven to six – enough to change at least the texture of the result, particularly in the islands and the west.
This exercise is rough: uniform swing is a useful average but hides local variation, and weekly party shares carry wide confidence intervals. So we cannot say exactly which seats would have swung another way, but we can say that even a “Meh Election” produced enough movement to change the fate of a few would-be MSPs.
So, was it the Meh Election? Largely, yes. Engagement, trust, performance evaluations and political efficacy were essentially flat, and the debates barely moved the broader electorate. But the counterfactual suggests it would be wrong to conclude nothing at all happened.