Dr Richard Fletcher
Postdoctoral Researcher, Department of Journalism, City University London.
Prof Steve Schifferes
Professor of Financial Journalism, Department of Journalism, City University London.
Section 2: Voters, Polls and Results
- Lies, damned lies and opinion polls
- How could the polls have been so wrong?
- Using social media to predict the General Election?
- Mediaptating the ‘civic imperative’
- A transitional parliament
- Bringing out the youth vote? Young people and the 2015 General Election
- Liars, bullies, confused and infantilised… and that’s just the electorate: the roles ascribed and the portrayal of members of the electorate in election TV coverage
One of the most popular journalistic narratives to emerge following the election has been the failure of almost all opinion polls to correctly predict the result. The polls typically predicted that Labour and the Conservatives would get about 32-35% of the vote each, that UKIP and the Liberal Democrats could expect around 13% and 8% respectively, and that the Greens and the SNP would return around 5%. Much of this, including the predicted vote share for the Liberal Democrats and UKIP, actually turned out to be correct. However, on the crucial question of who would win the election, the polls predicted a hung parliament rather than a Conservative majority. Unsurprisingly, it is this that most journalists have focussed on.
A number of things could have caused the polls to get it wrong. There could have been a last-minute swing to the Conservatives that the polls were unable to detect because their fieldwork had already stopped. The polls could have been distorted by the responses from so-called ‘shy Tories’ – a form of social desirability bias that results from people being embarrassed to admit they might vote Conservative when asked. Or, there could be another as yet unidentified flaw in the underlying survey methodology.
if there was a late surge towards the Conservatives, evidence for it probably can’t be found on Twitter
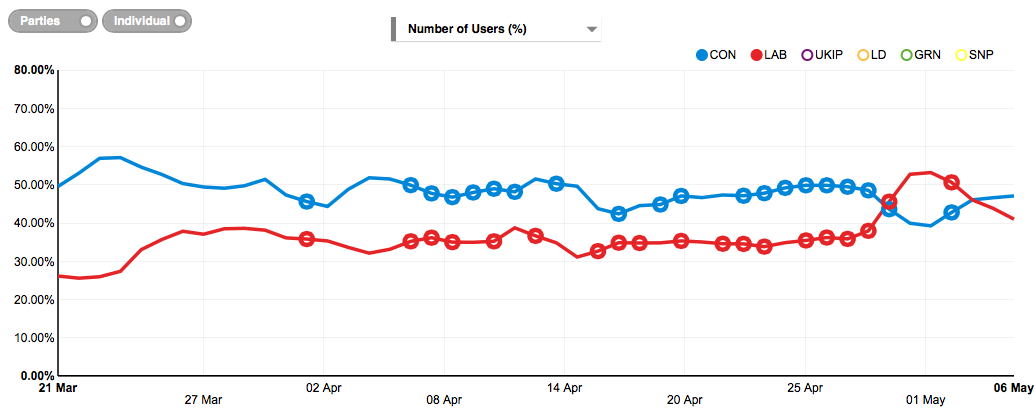
Together with researchers at the University of Warwick and the Centre for Research and Technology, Hellas (CERTH), we also tried – with similar levels of success – to predict the result. However, our approach, which was based on the automated identification, collection, and analysis of around 160,000 tweets per day, also allows us to paint a more detailed picture of the election than the national polls imply. It allows us to spot the more subtle fluctuations that averaged national polls might have papered over, as well as giving us a window onto what just before the election when much traditional opinion polling had stopped.
What does this data reveal? During the early part of the election period, the Conservatives were more commonly referred to than any of the other parties, with around 40% of all tweets about the election referring to them in some way. Labour were in second place with around 30%.
This pattern held until the beginning of May, when Labour overtook the Conservatives for the first time. As our charts show, this shift coincided with the broadcast of the BBC’s Question Time: Election Leaders Special, and occurred shortly after Ed Miliband was interviewed by the comedian and activist Russell Brand. At the time, we thought that this might lead to a late swing towards Labour, but as we can see, this surge disappeared before polling day. What’s more, by May 6th the trend showed signs of going in the opposite direction, and thus appears to chime with the ‘last-minute Conservative swing’ theory.
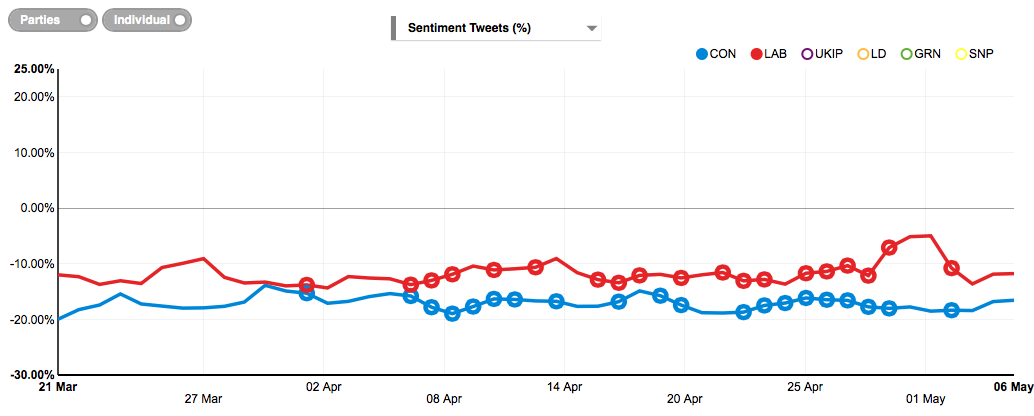
Of course, parties can be referred to in both a positive and negative sense, so just looking at the number of tweets may be misleading. Using an approach based on automated sentiment analysis, we are also able to look at just those tweets that express positive sentiment.
If we do this, we see that the rise (and then fall) in the total number of tweets mentioning the Labour party was driven by positive sentiment towards them. This appears to have been a genuine Labour surge. In contrast, the number of positive tweets mentioning the Conservative party remained fairly steady. This suggests that if there was a late surge towards the Conservatives, evidence for it probably can’t be found on Twitter. What seems more likely is that the greater salience of the Labour Party in the last week of the campaign ultimately led to a decrease in positive sentiment towards Labour. So it could be that differential turn-out, a reduction in Labour supporters who actually turned up at the polling both, might be a better explanation of the result. Although social media can provide clues to the final share of the vote, there is clearly the need for further investigation of why the polls got it so wrong, and how more detailed analysis of social media trends could help improve the precision of any election vote-share predictions.